The finance people love their black and white reports. Each month they bang out grisly, unreadable financial statements. How do I know? Because I’m one of those finance people, cranking out bland report after bland report.
I’m here to repent, and show you a better way.
Nobody likes reading a set of financial statements that resemble an eye chart with numbers so small they are barely legible. Financial statements should be fun to read, easy to digest and understand. It’s time to spice up the numbers, add some color and info-graphics, and let the magic begin. It’s time for some fun-ancial statements.
We are on information overload. There’s so much data is competing for our attention and our number-heavy financial statements are just one more example. So here’s an idea to ease the burden: Use infographics in place of your traditional financial statements.
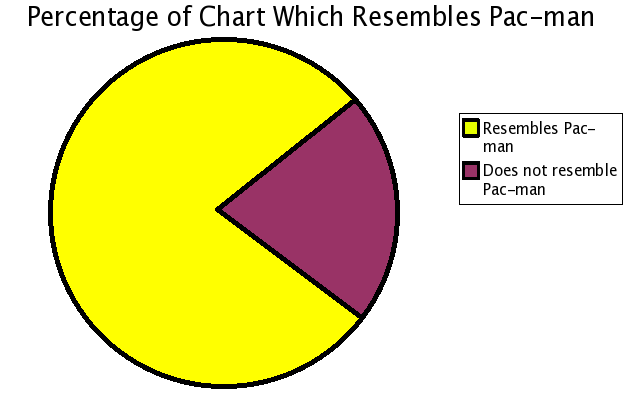
An infographic is a visual image that represents data. For example, check out the pie chart above that looks like Pac Man. Our brains like these simple, colorful graphs and pie charts.
There are many compelling reasons to use infographics for your financial information:
Researchers have found that colorful visuals increased the willingness to read by 80%. You read that Pac Man visual, didn’t you? Welcome to the 80%.
It takes less than 1/10 of a second for the brain to recognize a symbol to be processed and attach meaning to it. Think of the stop sign or yield sign when you’re driving – you know instantly what it means. Pictures quicken up the brain. There are numbers on our financials that take me weeks to figure out – would be nice to recognize and process that information in less than 1/10 of a second.
Comprehension and retention increases. People remember 80% of what they see and do, but only 10% of what they hear. No wonder I don’t remember anything my wife tells me. She could use some infographics to tell me about her day.
Our brains love visual information – pictures, videos, anything other than words or numbers. Yet, our financial statements haven’t kept up with this visual craving. Info-graphics can help.
Don’t fight neuro-science, make it easy on yourself and use infographics. Your brain will thank you.
Want more information on how to create infographics for your company? Click here to download our free step-by-step guide.


